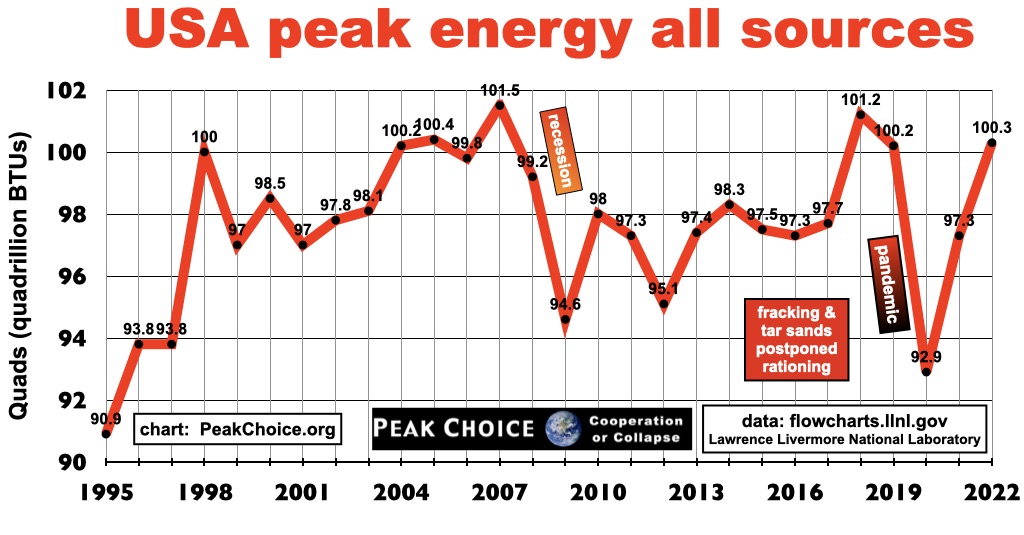
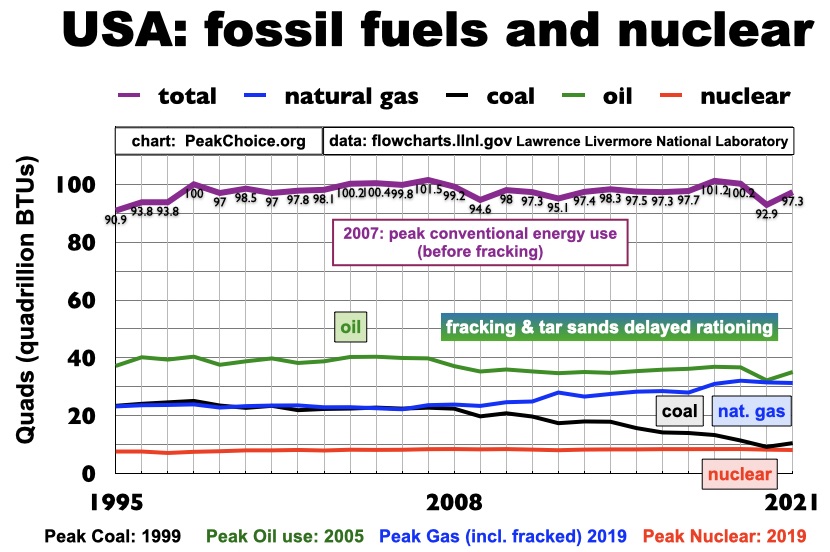
Peak Energy in the USA (all sources)
before fracking, 2007 - during fracking, 2018
related pages:
- Peak Electricity - before fracking - in the US was 2007
- Peak Airplanes - before fracking - was 2007
- PeakTraffic.org Peak Vehicle Miles Traveled - before fracking - was 2007
- What the Frack? Scraping the bottom of the oil barrel is not good to the last drop
![]()
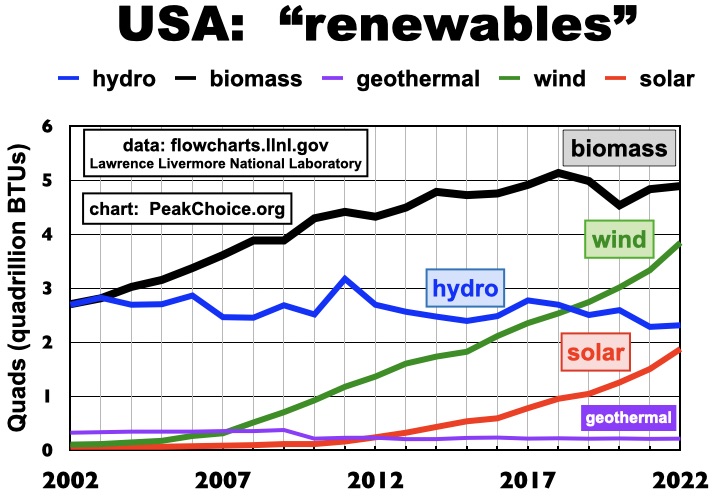
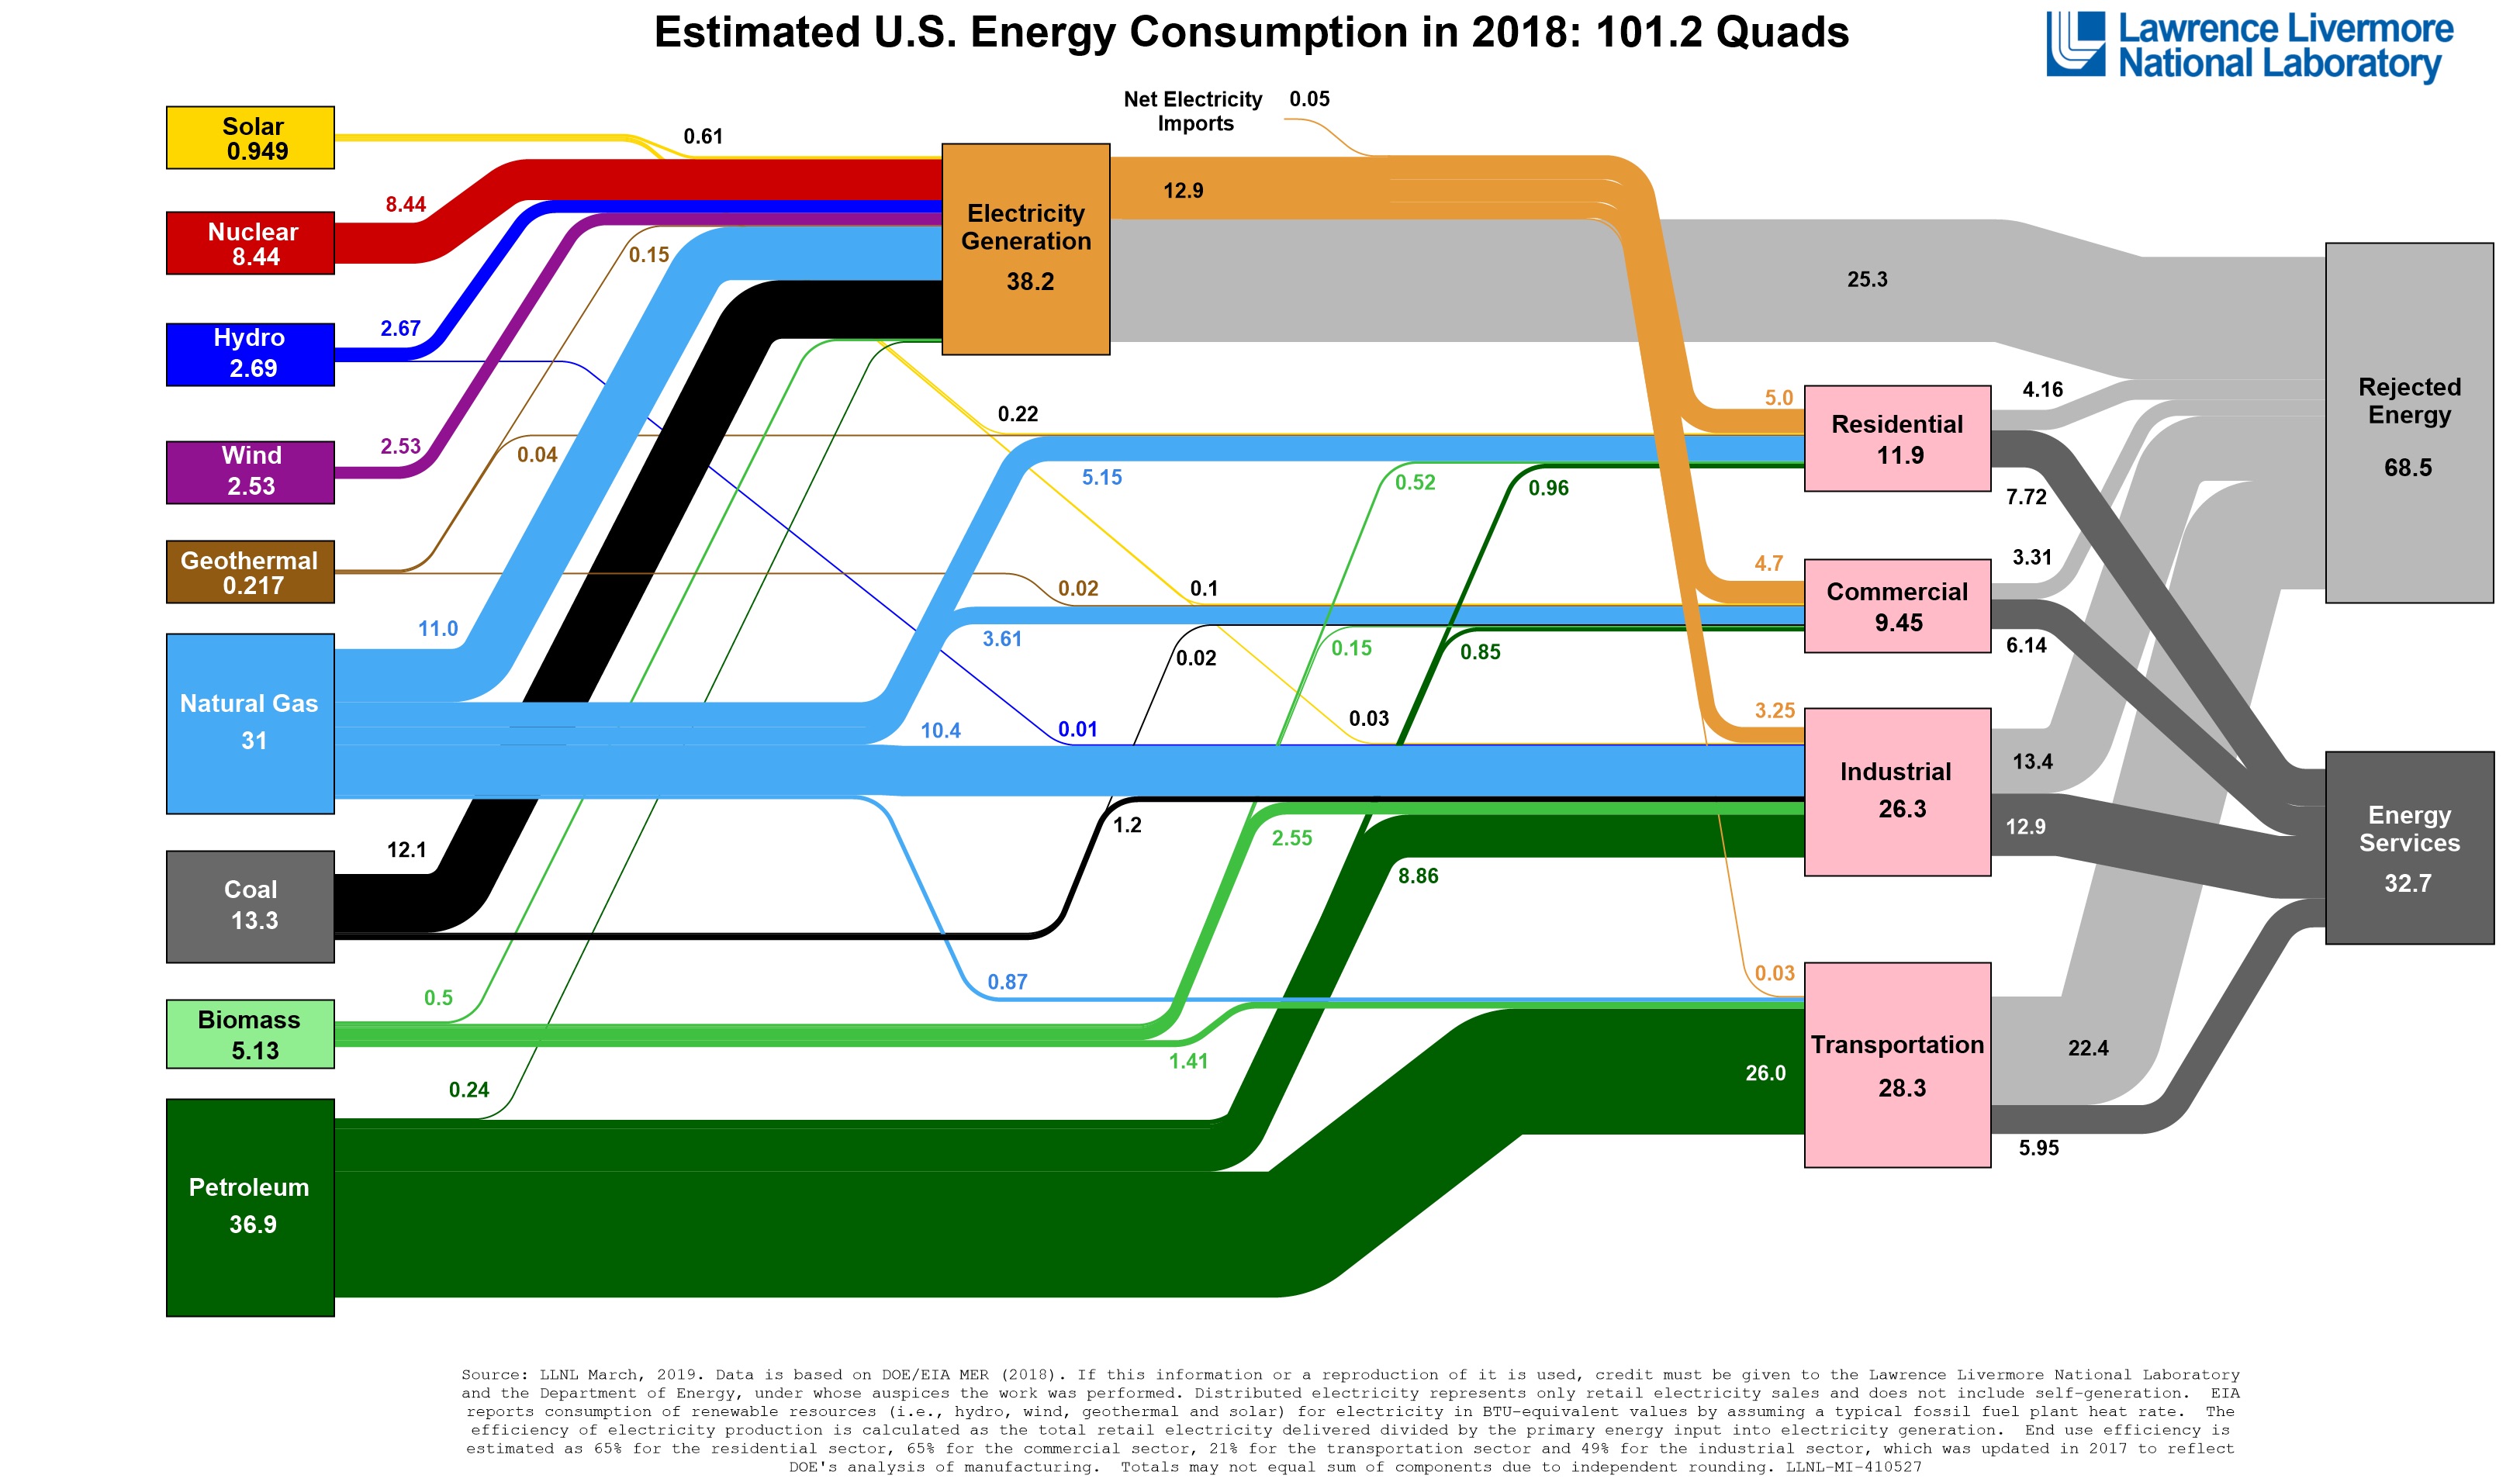
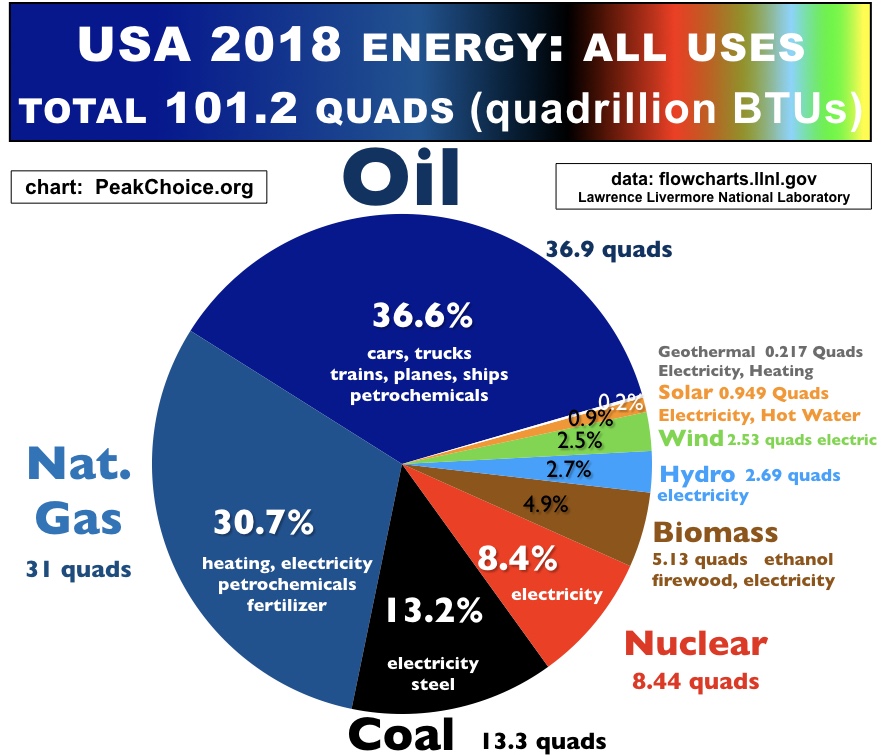
This chart from the U.S. Department of Energy is complex yet simple. It shows what each major energy source is used for: coal, nukes, and dams make electricity, oil is mostly for transportation, natural gas is used for heating homes, electricity, and industrial processes. Those sources are either near or at their peak. In the short run we need efficiency to mitigate the early stages of decline. We also need to reduce consumption for ecological and social justice reasons. Scaling up forest biomass to replace coal and fracked natural gas would require massive expansion of deforestation. A "quad" is a quadrillion British Thermal Units (one BTU is roughly equal to lighting a match).
USA energy consumption data from flowcharts.llnl.gov Lawrence Livermore National Laboratory